
CropSupport is a digital tool that enables farmers to collect and supply in-situ data in exchange for Value-added Agricultural Service. CropSupport is consisted of the web and mobile applications
Value-added Agricultural Service for Farmers
Farmers use CropSupport to collect and supply data in exchange for tailored Agricultural Services
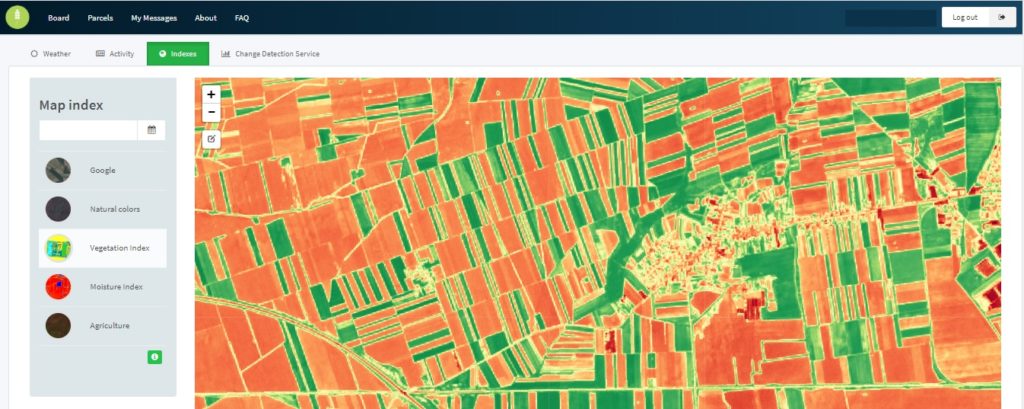
NDVI indicators – CropSupport offers the insight into 4 specific NDVI indicators: Agriculture map, Moisture index, Natural Colour and Vegetation Index. From these NDVI maps farmers can get early warnings for possible stress caused by pests, diseases, lack of moisture or soil nutrients.
Weather forecast – A parcel-based weather forecast allows farmers to acquire valuable and field-specific information related temperature, pressure, precipitation, humidity, wind speed & direction and cloudiness.
Change Detection Service – This service automatically analyses a time-series of satellite imagery to detect potential variations, anomalies and change in crops. Farmers can trigger Change Detection Service for each parcel they observe.

The CropSupport web-based application is an interactive platform that can be accessed once users register for an account. The main functionalities of the web application are:
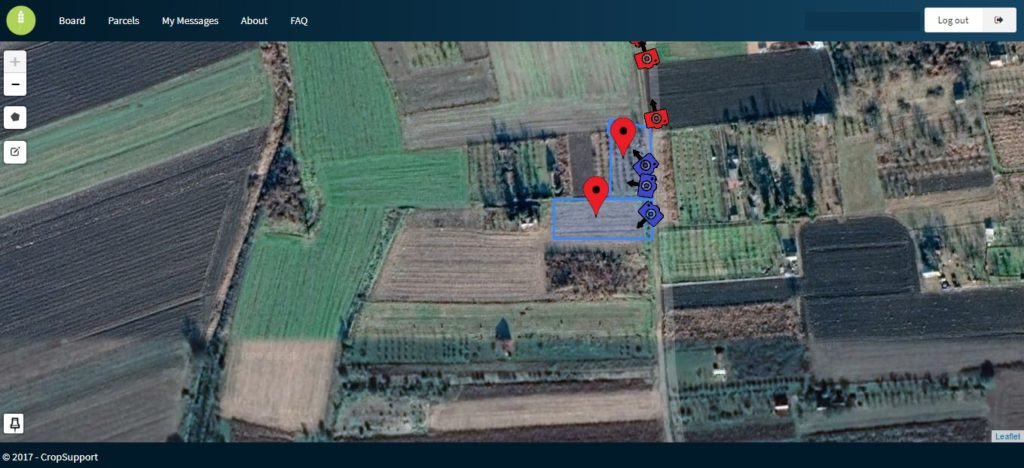
- Possibility to outline the contours of a field parcel over a base layer imagery from Google
- Indication and location of photos taken via mobile app (which appear on the user board)
- Parcel profile – allows user to acquire different information related to the parcel – weather forecast and NDVI maps. Also, this section allows user to access to “Activity timeline”, where s/he can take notes and keep records of variety of agricultural activities such as: tillage, planting, fertigation, plant protection and harvesting
- Communication channel for communication between a campaign leader and data-collectors
The Administrator Panel is an extension of the CropSupport web application, and it was developed to support monitoring of the crowdsourcing campaigns (i.e. users’ commitments and quality of collected data). In particular, via the main dashboard of the Administration Panel, a particular user contribution/activity can be monitored, such as number of: parcels, images, and activities (data related to farm activities such as seeding, fertilization, irrigation, etc.). Also, the user statistic provides specific information which help assess the quality of the user data sets – number of images connected with the parcels, number of images without parcels and parcels without activities. The Image Validity Control helps for monitoring and checking the collected data. In particular, this service enables the administrator to compare the content of image with the user’s claim. Statistics panel provides insights of overall performance for defined group of users and/or for whole campaign (different schools, group of students, etc.). Same as for individual users, aggregated data on total number of parcels, images and activities is available.